
Power BI with Claude AI: Auto-Generate DAX, Visuals & Semantic Docs

A Complete Step-by-Step Free Alternative to Power BI Copilot
Are you a Power BI developer or data analyst looking to leverage cutting-edge artificial intelligence to speed up your development workflow, but you don’t have a premium Microsoft Fabric or Power BI Copilot license?
In this step-by-step tutorial, we will explore an incredibly disruptive integration between Power BI Desktop and Anthropic’s Claude AI. By exploiting Power BI’s text-based project formats, you can transform Claude into an expert co-developer that works directly on your local project files completely for free.
Introduction
If you have ever felt left out because your organization hasn’t provisioned a Power BI Copilot license, this workaround changes the entire development game. By pairing Power BI’s newer project saving capabilities with the custom workspace context of Claude Projects, you can automate your most tedious tasks seamlessly.
Whether you need to generate exhaustive semantic model documentation for a migration project, inject fresh DAX calculations natively into your tables, or spin up fully configured visualizations out of thin air, this local file methodology handles it all without costing a dime in enterprise licensing fees.
Why PBIP Files are the Secret Sauce
Before diving into the setup, we must understand the underlying file technology that makes this magic trick possible.
Traditionally, Power BI saves workbooks in a binary .pbix format. Because a .pbix file is a closed, compiled package, large language models (LLMs) cannot natively read its internal logic, trace its relationships, or modify its structure. To bridge this gap, we use the Power BI Project (.pbip) file format.
When you save a workbook as a .pbip file, Power BI splits your single monolithic file into a human-readable folder structure. This launcher architecture separates your project into two distinct directories:
The Semantic Model Folder: This contains your data model structure, data table definitions, relationships, columns, metadata, and existing DAX measures stored in standard text files using Tabular Model Definition Language (TMDL).
The Report Folder: This houses your actual visual canvas layouts, page configurations, custom visual setups, and theme properties in structured JSON files.
Because these folders contain raw, human-readable text configurations, Claude can easily scan them, interpret their logic, write to them, and modify your actual Power BI file architecture cleanly.
Step-by-Step Guide: Integrating Power BI with Claude AI
Follow these precise steps to connect your local files to Claude and start automating your data modeling workflow.
Step 1: Export Your Project as a PBIP File
First, open your target workbook inside Power BI Desktop. We need to save the file into the developer-friendly project format.
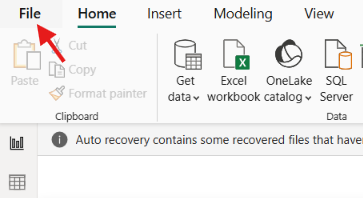
1.Navigate to the top left corner of the ribbon and click on File.
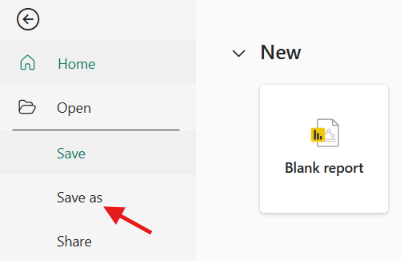
2. Select Save as from the dropdown options.
3. Choose your destination directory.
4. In the Save as type dropdown menu, select Power BI project files (*.pbip).
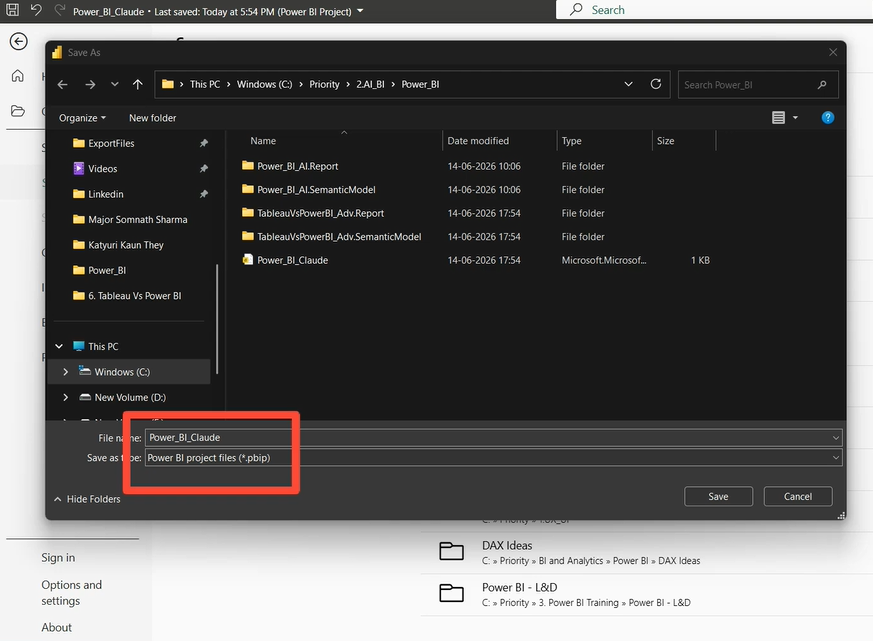
5. Click Save.
Once saved, navigate to that directory using your file explorer. You will see a launcher file sitting in parallel with a dataset directory and a report directory.
Step 2: Zip and Upload Your Files to Claude
Claude needs to receive these configuration folders cleanly. The most efficient way to upload your project directory is by compressing the structural data folders into a single archive.
Highlight both the Semantic Model folder and the Report folder inside your file explorer.
Right-click the highlighted folders, select Compress to ZIP file, and name it (e.g., PowerBI_Project_Files.zip).
Open your Claude Desktop client (or navigate to the web version).
Select the Projects feature on the sidebar and click Create New Project.
Name your project (e.g., Retail AI Analysis).
Click Add Files and upload your newly created .zip folder into the project context window.Automating 3 Core Power BI Workflows with Claude
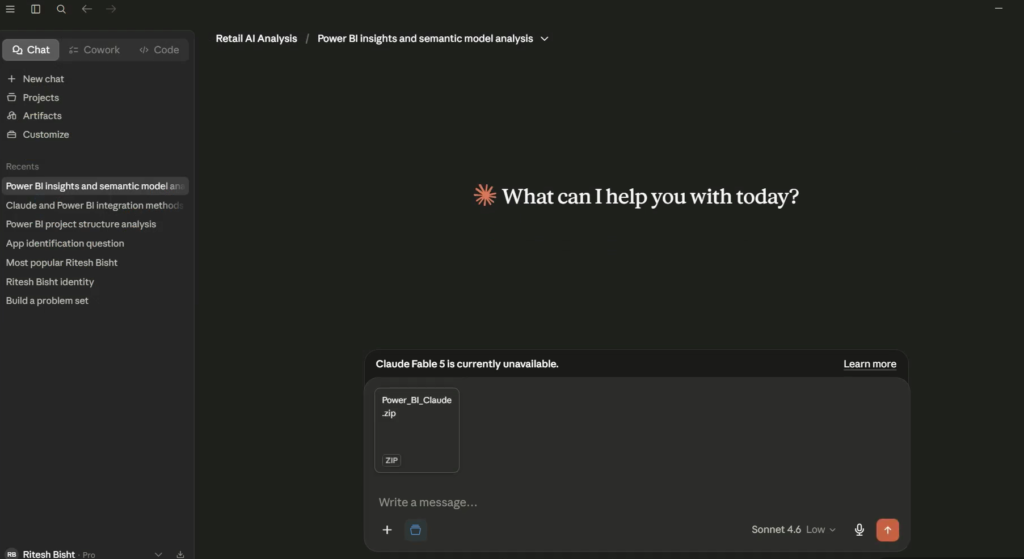
Uploading the compressed Power BI folder structure into a Claude Project space.
1. Auto-Generating Complete Semantic Model Documentation
Data analysts are frequently tasked with creating clean documentation for enterprise models. Manually mapping out relationships, tables, data types, and measures can take hours. With Claude hooked up to your text-based data model, this chore is reduced to a single prompt.
User Prompt: “Please analyze the files inside this project zip archive and derive the semantic model information in the form of a structured document. Read the TMDL files and produce documentation detailing our tables, relationships, column metadata, storage modes, source types, and tags.” |
Claude will access your archive, parse the underlying Tabular Model Definition Language (.tmdl) files, and immediately understand how your data is wired together. It will generate a pristine, structured technical breakdown right in the chat window, including active/inactive table relationships, storage modes (Import vs. DirectQuery), and source metadata. This can be instantly copied into your internal technical handbooks or project handover reports.
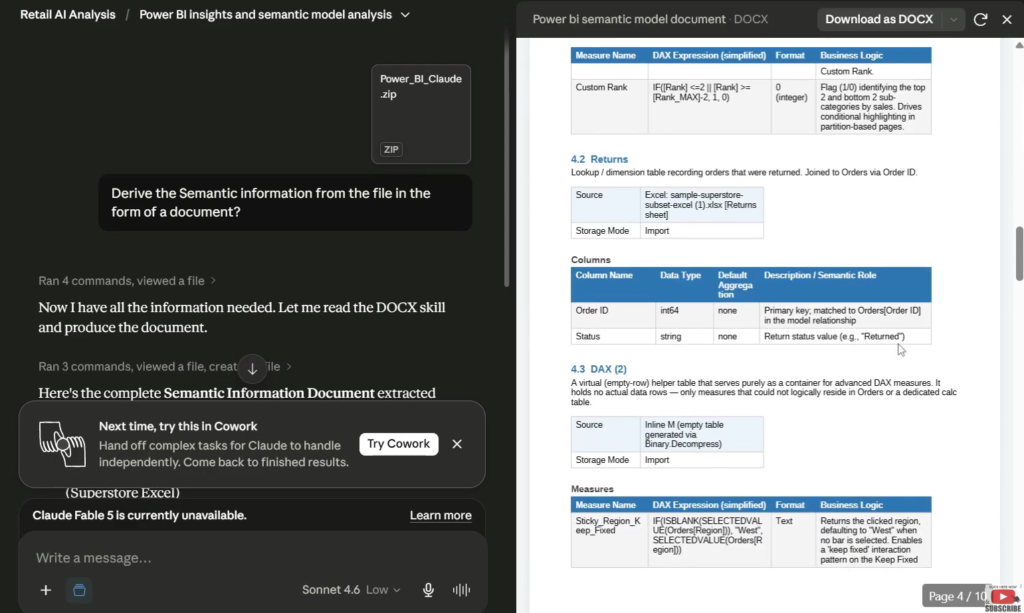
Claude parsing model schema data to auto-generate enterprise-grade documentation.
2. Injecting New DAX Measures via AI Code Generation
Writing a complex DAX statement is easy enough, but manually opening Power BI, clicking ‘New Measure’, typing the code, and waiting for the model to compile can slow down your velocity. Let’s have Claude write and inject a new DAX measure straight into our model file.
User Prompt: “I want to add a new DAX measure to calculate the number of days between ‘order date’ and ‘ship date’ using the PBIP files in this project. Scan the ‘order.tmdl’ file to find the correct table structure, place this new measure right after the existing ‘custom rank’ measure, and repack the files into an updated zip archive so the model is updated.” |
Claude searches the zipped archive, isolates order.tmdl, locates the exact line where the custom rank measure is defined, and cleanly appends your new aging calculation directly into the underlying code layer using proper TMDL syntax:
measure ‘Orders'[Days to Ship] =
DATEDIFF(
SELECTEDVALUE(‘Orders'[Order Date]),
SELECTEDVALUE(‘Orders'[Ship Date]),
DAY
)
Claude will then automatically repack the modified files into a fresh zip archive and present it as a downloadable chat link.
To apply it, simply download the updated zip file, extract its contents directly over your original local project folders (replacing the old files), and open your primary .pbip file. Your brand new, fully working DAX calculation will be sitting inside your data model, completely ready for production visuals!
3. Generating a Report Visualization Canvas out of Thin Air
Let’s push this technique to its absolute limit. Instead of just editing the background data layer, we can ask Claude to design a report layout page and build a visual from scratch.
User Prompt: “Let’s go one step ahead and add a visualization showing sales by region. Create a new page with a polished donut chart. Ensure you include standard data labels displaying percentages of total, an aligned legend, a clear title, and cohesive per-region colors. Update the layout files in the project and provide the updated zip file.” |
Claude navigates directly into your .Report directory, targeting the complex layout JSON files that manage visual coordinates, canvas dimensions, and page states. It drops in a fully populated page block, configures a donut chart component object, maps your sales and region fields to it, and provides an updated zip file download.
Unpack this final zip archive over your local directories and launch the project. When Power BI Desktop opens, you will see a newly minted canvas page containing a crisp, beautifully formatted donut chart with percentages of total displayed perfectly.
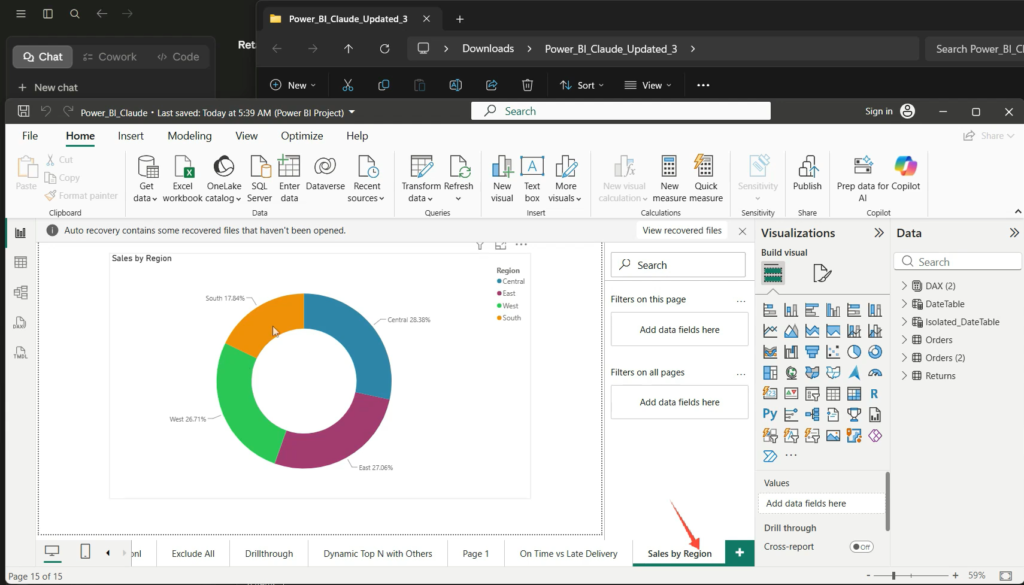
The final result—a perfectly formatted donut chart generated directly via file modification
Summary & Key Takeaways
-
Free Power BI Copilot Alternative: You do not need a premium organizational Power BI Copilot license; you just need to utilize native .pbip file conversions.
-
The Power of TMDL: Saving workbooks as Power BI Project files exposes hidden code assets (like TMDL data schemas and layout JSON files) that LLMs can instantly read and rewrite.
-
Instant Documentation: Claude can audit an entire enterprise model in seconds, creating rich documentation detailing complex relationships and metadata tags.
-
Direct Architecture Modification: You can command the AI to inject structural measures or layout visual updates, then unpack the output files to see the changes take effect inside your local desktop client instantly.
Watch the Full Video Tutorial
To see this entire process executed in real time—including how the folder structures look, how Claude handles the zip files, and watching the donut chart pop up live on the canvas—check out the full video below:
Note: If you want to get direct access to the sample project files and templates used throughout this demonstration, drop an email to support@dancesingwithdata.com , and we will share them straight to your inbox. Until next time, keep on dancing with data!
