
Preventing Aviation Hazards: How Tableau and AI Drive Smart Wildlife Strike Mitigation
Wildlife strikes pose severe risks to modern aviation, costing regional airports millions of dollars in repairs every year. Leveraging Tableau AI wildlife strike mitigation tools allows aviation teams to transform raw FAA incident data into proactive safety operations. By replacing static reporting with real-time intelligence, airport managers can predict bird strike hazards and protect aircraft during critical flight phases.
The Escalating Threat of Airport Wildlife Strikes
Bird strikes happen frequently during critical phases of flight. Aircraft usually encounter birds during takeoff, approach, and landing sequences. Small birds can disable engines and damage delicate aircraft surfaces rapidly.
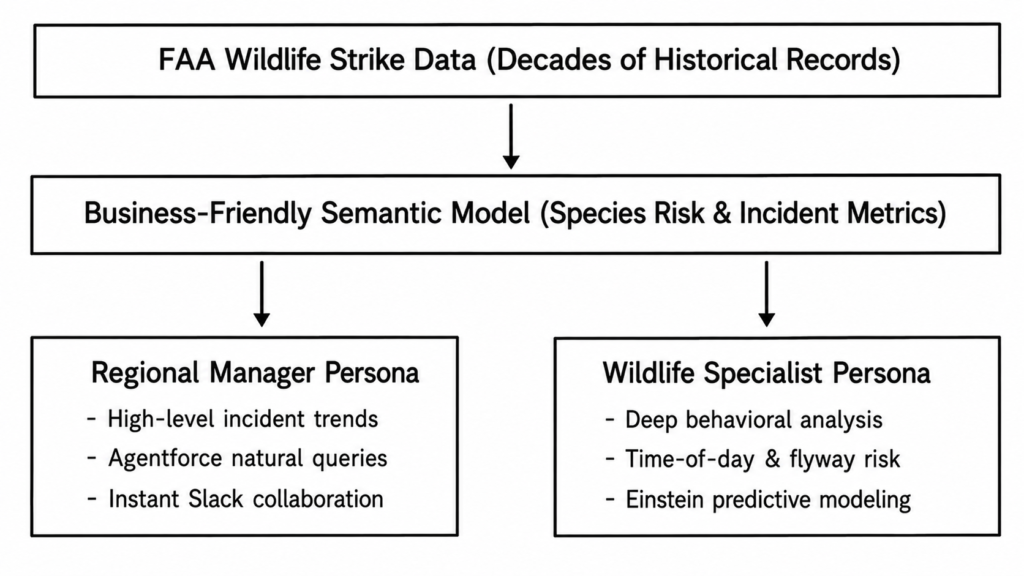
Traditional reporting systems lack dynamic real-time reporting capabilities. Regional managers need immediate data to deploy effective deterrents quickly. Therefore, integrating intelligent analytics directly into airport workflows is vital.
Building an Intelligent Semantic Model with Einstein AI
We built a business-friendly semantic model to simplify raw datasets. The model translates complex numbers into accessible terms like species risk. Thus, users can inspect critical aviation metrics without technical barriers.
[FAA Data Source] —> [Einstein AI Field Generation] —> [Tableau Next Data Layer]
Einstein AI accelerated our visual development process tremendously. We generated complex calculated fields within seconds using plain language prompts. This rapid workflow unlocked deeper analytical insights without manual coding.
Exploring Regional Airport Analytics via Agentforce
Airport managers log into a comprehensive executive dashboard daily. They filter incident trends by date, airport, species, and damage. However, natural language querying elevates this visual analytics experience further.
Agentforce allows users to ask complex business questions directly. For example, a manager asks which southern airport experienced the highest strikes. Agentforce identifies the exact airport and returns a count of 155 strikes.
User Query: “Which southern US airport has the highest strikes this year?”
│
▼
[Agentforce AI Engine]
│
▼
Result: Airport Identified | Verified Strike Count: 155
We filtered the underlying dashboard data to verify this result manually. The dashboard confirmed the exact count of 155 incidents immediately. Next, we identified the primary species causing these strikes: the Mourning Dove.
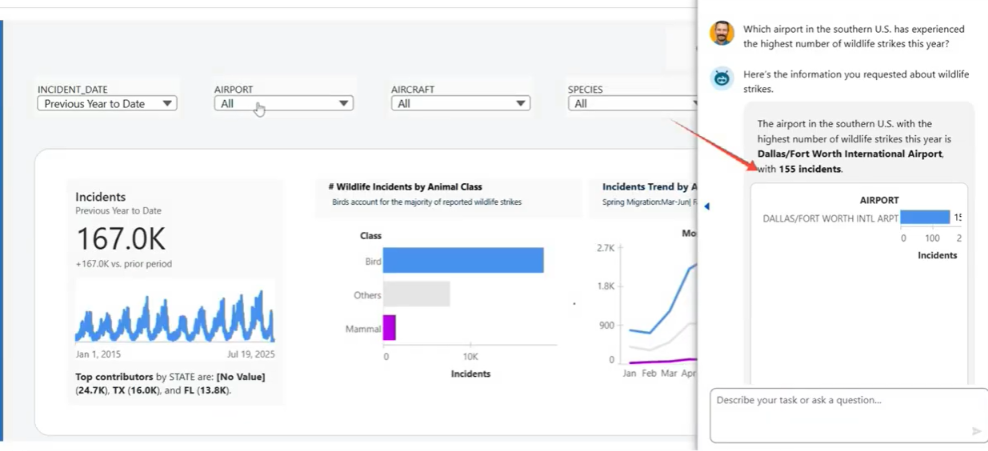
A screenshot of the Agentforce conversational interface returning airport strike counts. It shows the prompt bar, verified result of 155 strikes, and target airport details.
Uncovering Key Strike Factors with Tableau Metrics
We opened Tableau metrics to analyze additional contributing environmental factors. Understanding animal size and phase of flight helps focus preventive efforts.
Phase of Flight: Most strikes happen during approach and landing.
Animal Size: Smaller birds account for the highest volume of strikes.
Location Impact: Specific runways experience higher local bird activity.
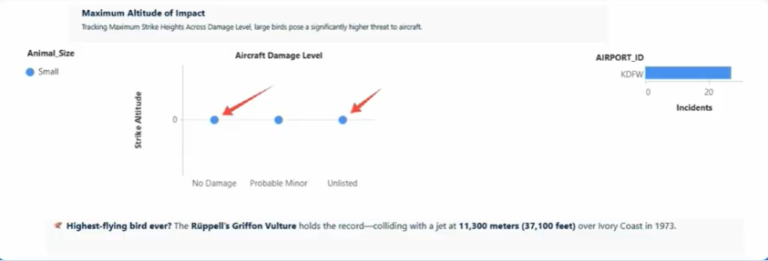
A clear view of Tableau metrics displaying bar charts for flight phases (approach, landing) and bird size distributions (small vs. large).
These analytical discoveries help ground teams shape targeted mitigation strategies. Managers share these critical insights directly with wildlife specialists via Slack. The embedded links let specialists explore live dashboards instantly in Tableau.
Deep-Dive Analysis for Wildlife Specialists
The wildlife specialist persona requires deeper ecological and temporal details. Specialists filter data by the identified species and target airport location.
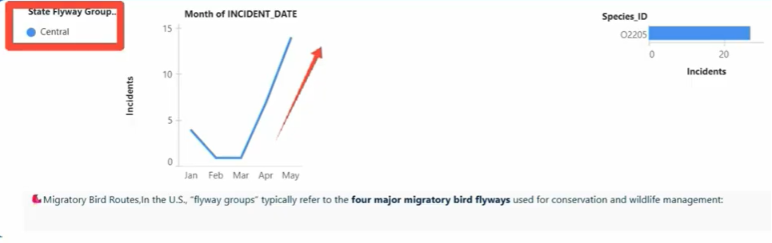
The verified dataset reveals 27 specific Mourning Dove strike incidents. These strikes occur at low altitudes during takeoff and landing. Furthermore, trend charts show rising activity within the Central flyway group.
Specialists ask whether strikes occur during specific times of day. Data confirms Mourning Doves are most active during daylight hours. Early morning windows present the highest risk for arriving aircraft.
Early Morning Activity Peak —> Higher Strike Risk —> Targeted Deterrent Deployment
Airport teams can now schedule targeted wildlife patrols effectively. Ground crews deploy deterrents precisely when bird activity reaches peak levels. Furthermore, air traffic control can adjust runway usage during high-risk windows.
Evaluating Aircraft Vulnerability and System Interoperability
Certain aircraft types are significantly more vulnerable to bird strikes. Identifying these models helps airlines manage schedule exposures more safely.
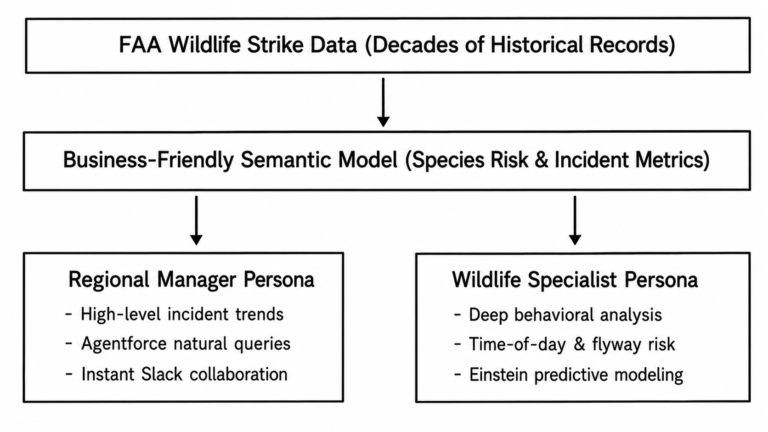
Tableau Next currently lacks native specialized mapping components. However, Tableau’s strong interoperability bridges this visual gap effortlessly. We connected Tableau Desktop to Tableau Next cloud data sources directly. This hybrid setup unlocks advanced geospatial mapping without losing central cloud data.
Proactive Risk Reduction with Einstein Model Builder
Analyzing historical incidents only explains what happened in the past. Therefore, we built a predictive model using Einstein Model Builder.
Input Variables:
├── Local Climate Data
├── Geographic Location
├── Aircraft Mass
└── Species Type
│
▼
[Einstein Model Builder]
│
▼
Output: Air Damage Probability Score (%)
This machine learning model estimates air damage probabilities accurately. Consequently, airport authorities gain a proactive edge in managing wildlife risks.
Transforming Aviation Safety Through Collaborative AI
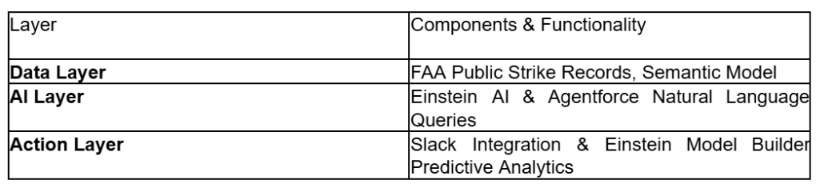
Our submission combines cloud analytics, conversational AI, and predictive modeling. This platform turns static operational data into an active risk prevention system.Airport managers and wildlife specialists can now collaborate seamlessly. Together, they prevent dangerous collisions, save lives, and protect critical equipment. This solution is far more than a dashboard—it is intelligent aviation safety.
Summary
By integrating Tableau’s cloud capabilities with conversational AI and predictive modeling, our solution transforms raw aviation strike data into proactive safety measures. From executive trend monitoring to targeted field deployments, airport teams now have the real-time insights required to protect aircraft, reduce repair costs, and save lives.
Watch the Full Video Tutorial
To see this entire process executed in real time, check out the full video below. You will see exactly how the folder structures look, how Claude handles the zip files, and how the donut chart pops up live on the canvas.
Video Link: Watch the Tutorial on YouTube : Tableau Next Hackathon – Wildlife Risk Intelligence for Aviation
You might also enjoy this insightful blog on Power BI : Tableau AI Agent
To download the latest version of Power BI Desktop compatible with project file tracking, visit the official Microsoft Power BI Download Center download
Note: If you want to get direct access to the sample project files and templates used throughout this demonstration, drop an email to support@dancesingwithdata.com , and we will share them straight to your inbox. Until next time, keep on dancing with data.
