
How to Migrate Tableau Dashboards to Power BI Using Claude AI
Learn Tableau to Power BI Migration using Claude AI. Convert Tableau dashboards, LOD expressions, and data models into Power BI with this step-by-step guide.
Why Migrate with AI Support?
Migrating dashboards from Tableau to Power BI can be challenging, especially when translating complex calculations such as Level of Detail (LOD) expressions into DAX. This Tableau to Power BI Migration guide demonstrates how Claude AI simplifies the entire process by analyzing Tableau workbook files, generating migration documentation, and helping you recreate dashboards accurately in Power BI.
Step-by-Step Migration Guide
Step 1: Initialize Your Claude AI Project and Upload the Workbook
The first order of business is setting up your migration workspace inside Claude AI. Instead of using a standard chat window, creating a dedicated “Project” lets you attach reference files that Claude will persistently use as context.
1. Log into your Claude AI account and select Projects from the dashboard.
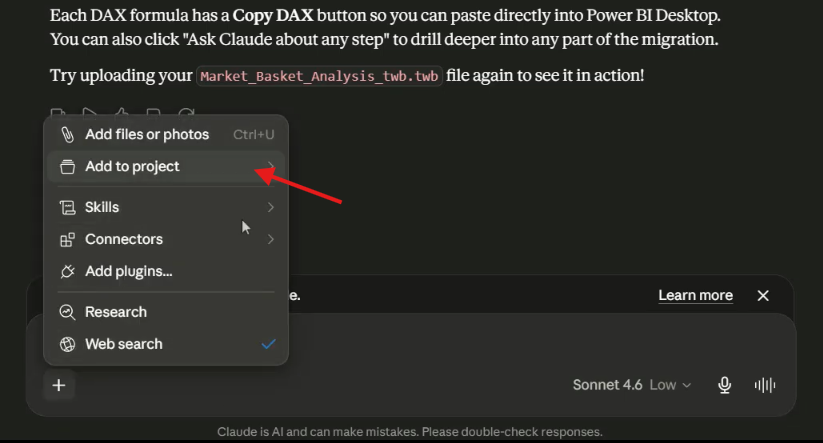
2. Click Create Project and name it something descriptive, such as Tableau to Power BI Migration.
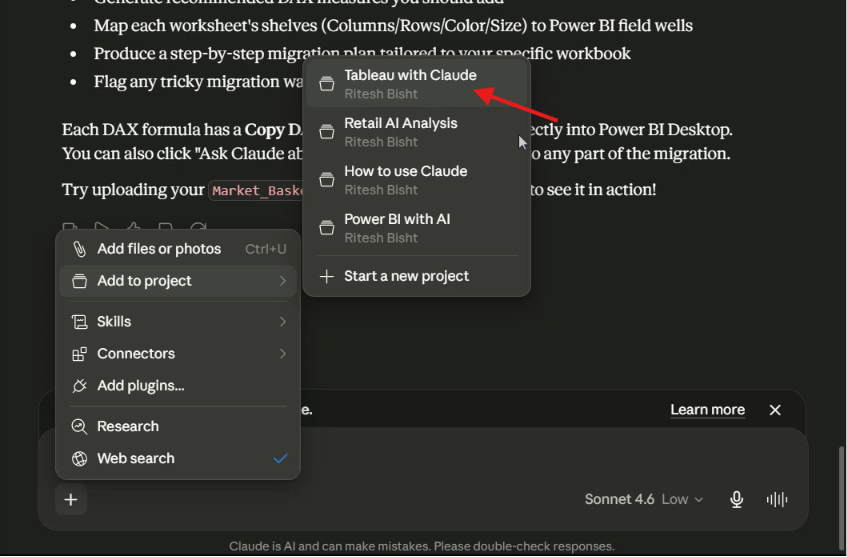
3. Click on the file upload button and select your Tableau workbook file.
Note: Always upload the .twb (Tableau Workbook) file rather than a .twbx (packaged workbook). The .twb file is pure XML code, which contains the complete architectural map of your data sources, relationships, and metadata calculations that Claude needs to read.
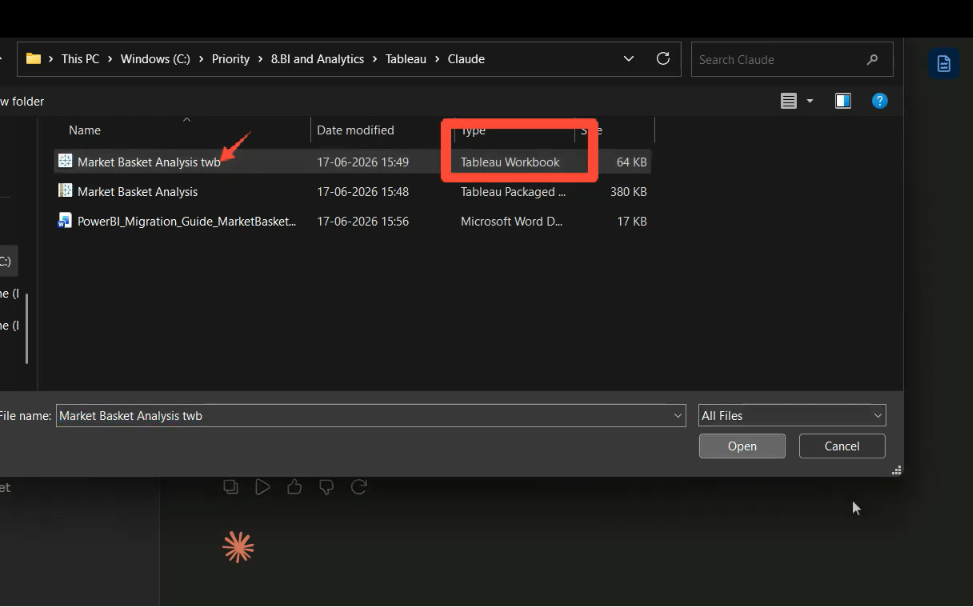
Step 2: Generate the Migration Documentation Script
Once your file is uploaded, you need to prompt Claude to parse the XML layout and extract an execution plan.
Enter the following prompt into your project chat:
“Please prepare formal documentation that provides step-by-step guidance for converting this report into Power BI.”
Claude will read the .twb file structure and build a detailed documentation artifact. This generated guide outlines:
Tableau Properties Summary: A list of the parsed tables, data source paths (e.g., Excel or SQL servers), and visualization elements.
Custom Calculation Audits: Automatic extraction of complex calculated fields (like your customer cohort LOD metrics).
Data Model Architecture: The current join structures that must be restructured into a classic Power BI star schema.
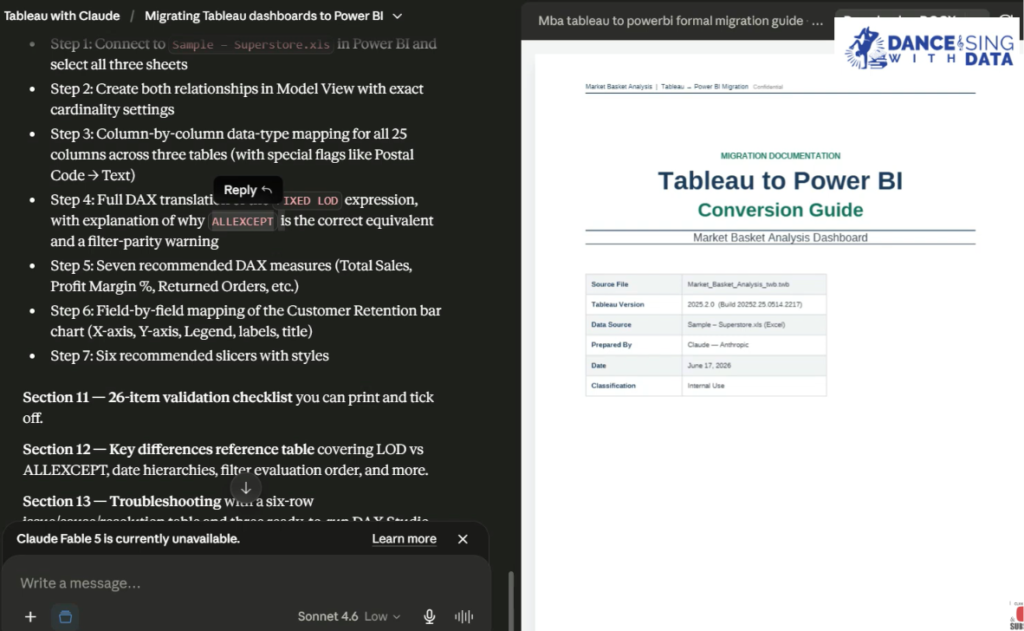
side-by-side view of the Claude AI project interface detailing the migration steps alongside the generated “Tableau to Power BI Conversion Guide” document artifact.
Step 3: Establish the Data Model in Power BI
According to the documentation generated by Claude, our example migration utilizes three core tables from the classic Sample Superstore dataset: Orders, People, and Returns. We need to pull these into Power BI and create an optimized data model.
Open a blank report in Power BI Desktop.
Go to the Home tab, click Excel workbook, select your data file, and check the boxes for Orders, People, and Returns.
Click Transform Data to open the Power Query Editor. This is where you should verify column data types (e.g., ensuring date fields are explicitly recognized as Dates).
Click Close & Apply to load the clean datasets into your model view.
Next, navigate to the Model View tab on the left-hand sidebar to define your relationships. Drag and drop the corresponding keys to match your star schema design:
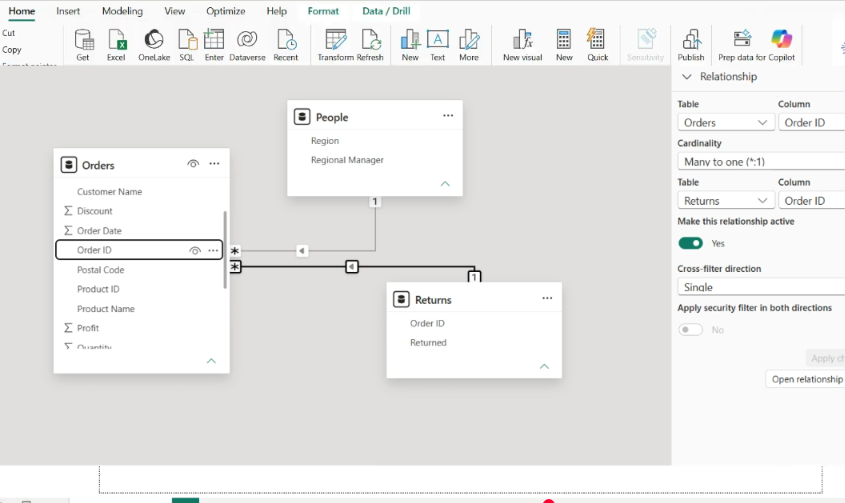
Structuring a clean star schema data model in Power BI Desktop
Link Orders to Regional Manager using the common Region column.
Link Orders to Returns using the `Order ID` column.
Step 4: Convert Tableau LOD Expressions to Power BI DAX
This is where the transition gets interesting. In the original Tableau dashboard, a cohort retention metric relies on a Level of Detail expression to isolate the exact date a customer made their very first purchase:
{ FIXED [Customer ID] : MIN([Order Date]) }
Power BI does not use a FIXED keyword. Instead, Claude translates this calculation into an explicit DAX calculated column using the CALCULATE and ALLEXCEPT modifiers.
Go to the Data View or Report View in Power BI.
Select the Orders table from your fields pane, right-click, and choose New Column.
Paste the DAX calculation script provided by Claude:
First Purchase Date =
CALCULATE(
MIN(Orders[Order Date]),
ALLEXCEPT(Orders, Orders[Customer ID])
)
This expression instructs Power BI to evaluate the minimum order date while clearing all filters on the Orders table except for the Customer ID. This mirrors the Tableau behavior perfectly.
Step 5: Build the Customer Retention Visualization
With our data model ready and our DAX column calculated, we can now configure the final dashboard presentation. We will create a stacked column visual to review how historical customer cohorts continue to purchase goods across subsequent operational years.
In the **Visualizations** pane, select the Stacked Column Chart icon.
Drag the standard Order Date from your fields pane over to the X-axis well. (Right-click it and ensure it is displaying the date hierarchy so you can isolate just the Year value).
Create a clean explicit measure for your metric tracking (e.g., Total Sales = SUM(Orders[Sales])) and drag it to the Y-axis well.
Finally, grab your newly calculated First Purchase Date column and slide it directly into the Legend well. Make sure this field is filtered to display the Year as well.
If the output initially looks like a grouped side-by-side bar layout, double-check that your visualization type is specifically switched to a Stacked Column Chart to properly layer your consumer retention categories.
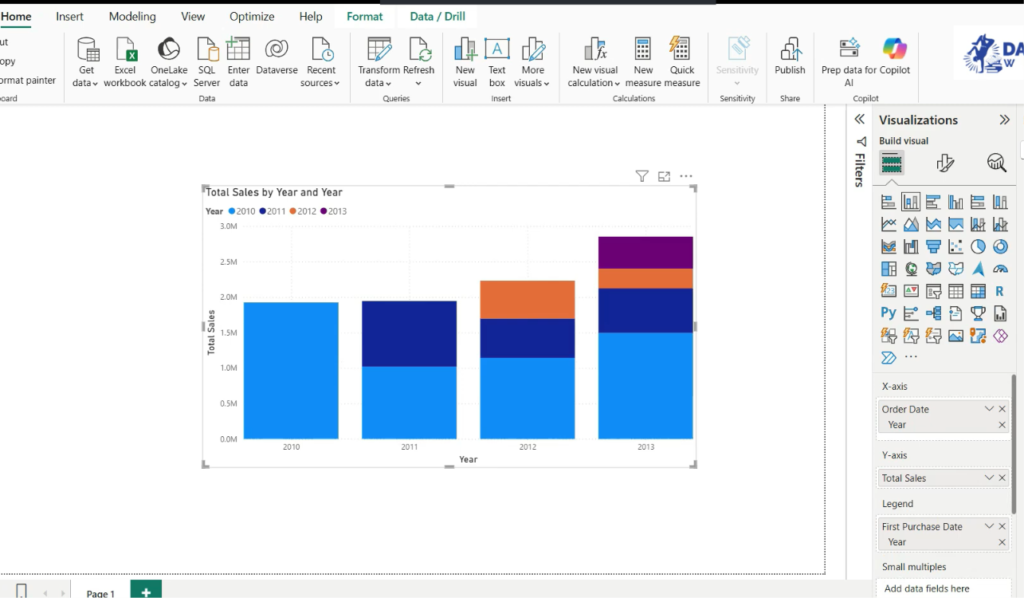
Replicating the original customer retention cohort visual cleanly in Power BI
The resulting visualization dynamically mirrors the classic Tableau cohort tracking layout, accurately validating key historical totals down to individual matching data points (such as an identical baseline sales volume match at 1,496,640!).
Key Takeaways & Migration Summary
TWB is the Key: Always feed Claude pure XML .twb files rather than packaged .twbx files to allow successful extraction of dashboard logic and calculation metadata.
LOD to DAX Equivalence: Tableau’s FIXED level of detail statements are effectively replaced in Power BI by combining CALCULATE() with scope-limiting modifiers like ALLEXCEPT().
AI as an Assistant, Not a Replacement: While Claude AI speeds up data model mappings and drafting DAX columns, you still need clean functional knowledge of both platforms to catch visual formatting changes and resolve edge cases. To understand more about PowerBI using Claude go through our recent blog Power BI with Claude AI: Auto-Generate DAX, Visuals & Semantic Docs
Watch the Full Video Tutorial
For a complete walkthrough of this process, check out the live step-by-step demonstration below:
Video Link: AI‑Powered Report Migration: Tableau to Power BI Simplified
If you are interested in learning how to enable Power BI Copilot, explore the blog: Enable Power BI Copilot: Availability and Trial Options
